For those who are not full time in the South Bay residential real estate business, it is probably difficult to decipher that there are seven distinct MLS areas in Redondo Beach.
Furthermore, some individuals may have trouble just defining the difference between North Redondo and South Redondo.
If you find yourself to be one of these individuals, be sure to check out our website for an easy breakdown on the MLS areas. Click here and the link will take you to our homepage where you can then click the “Neighborhoods” tab. Click on “Redondo Beach,” and from there, explore the seven different MLS areas with information on each, the current inventory, as well as some handy maps.
Golden Hills Tall & Skinny Homes
For this week’s post, I am diving into Golden Hills, one of the hottest areas in Redondo Beach.
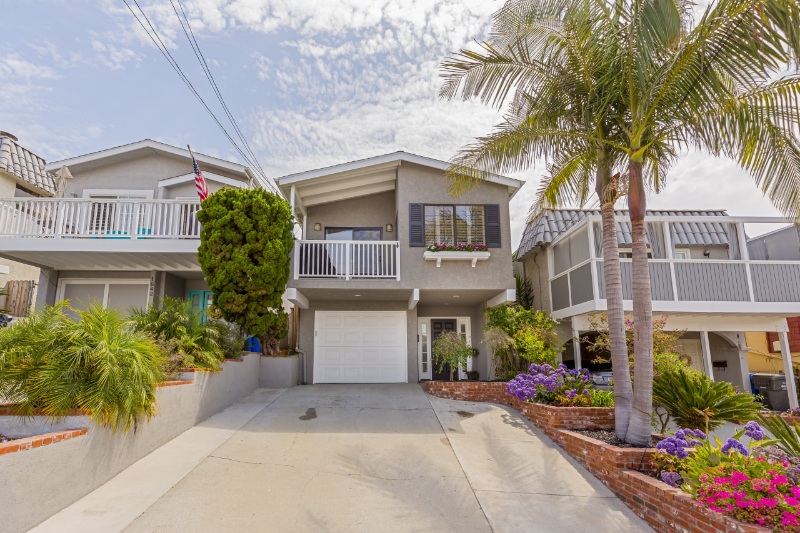
More specifically, I am focusing on what Golden Hills is known for – Tall & Skinny homes.
This specific type of home, mostly found in this area of Redondo Beach, is situated in neighborhoods with lots that are only 2,500 sq. ft. and that are strictly 25 feet wide. With that type of width and size, houses have nowhere to go besides up while maintaining a skinny profile.
Located near ever improving schools, the beach, and easy access to the freeway, this formerly affordable area has seen some of the strongest growth in all of the South Bay for median income home buyers.
I have watched this area continue to make record after record highs, year after year. And, there seems to be no end in sight.
My 2018 listing at 1640 Steinhart Avenue was a typical tall & skinny and one of the nicest remodels the market had seen in recent memory. We started our asking price at $1.179 million and sold in a week for $1.224 million, a high watermark for the product and neighborhood at that time.
- 1640 Steinhart Avenue
- 4 bed, 3 bath, 1,864 sq. ft.
- Sold: $1.224 million
Now, a year later, the market is continuing its amazing price appreciation.
Today, I am going to look at tall & skinny data (and livable sq. ft.) over the last three years. Then I will end with some data charts illustrating the short-term and long-term price growth.
Standard Tall & Skinny Homes
For me, the standard tall & skinny existing home is one that is between 1,700 and 1,900 sq. ft. with three bedrooms (sometimes four) and in clean condition.
If you look at the past few years of price performance, you would see a breakdown like this…
2017 Example Sales
- $1,150,000 Sale – 1526 Steinhart Avenue
- $1,175,000 Sale – 1738 Havemeyer Lane
- $1,189,000 Sale – 1636 Morgan Lane
2018 Example Sales
- $1,205,000 Sale – 1630 Haynes Lane
- $1,224,000 Sale – 1640 Steinhart Avenue
- $1,245,000 Sale – 1809 Goodman Avenue
2019 Example Sales
- $1,225,000 Sale – 1610 Stanford Avenue
- $1,275,000 Sale – 1618 Carver Street
- $1,310,000 Sale – 1741 Dixon Street
Sure these sales are cherry picked, but all of the interiors feel comparable and each exemplifies the standard tall & skinny home one would typically see.
After looking at the data over the last three years, prices have grown significantly.
- 2017: High $1.1 million range
- 2018: Low to mid $1.2 million range
- 2019: High $1.2 to low $1.3 million range
That is close to a $200,000 increase in price over the last two years.
Smaller Tall & Skinny Sales
When looking at the smaller/fixer tall & skinny homes between 1,000 and 1,400 sq. ft., one may be surprised to see that the data still continues to show a similar growth pattern.
2017 Example Sales
- $758,000 Sale – 1747 Axenty Way
- $800,000 Sale – 1630 Van Horne Lane
2019 Example Sales
- $856,000 Sale – 1711 Morgan Lane
- $1,070,000 Sale – 1628 Carlson Lane
New Construction Stays Stable
New construction tall & skinny homes between 2,100 and 2,400 sq. ft. looks to be stable and on the ups as well. Let’s compare 2017 sales to the present market…
2017 Example Sales
- $1,447,500 Sale – 1743 Spreckels Lane
- $1,450,000 Sale – 1745 Spreckels Lane
- 1,425,000 Sale – 501 Harkness Lane
2019 Example Sales
- $1,509,000 Sale – 1726 Steinhart Avenue
- $1,507,000 Sale – 1730 Steinhart Avenue
- $1,650,000 Sale – 1746 Carver Street
Again, a nice little jump here as well.
As you can see across the board, the tall & skinny market has only seen solid price appreciation.
Three-Year Charts vs. Long-Term Charts
Over the past three years, this asset class has shown no signs of weakness. The charts below can help illustrate the fluctuation and growth patterns more clearly than individual comparable sales.
Now remember, this is going to be a chart of the entire Golden Hills sub-market (MLS area 154) so it will not just be tall & skinny homes, but the majority of the data will be derived from tall & skinny homes since they are the dominant home type in the area.
First, let’s dive into the three-year chart data…
Three-Year Median Sale Price Data
Below is a Golden Hills single-family median sales price chart over the last three years.
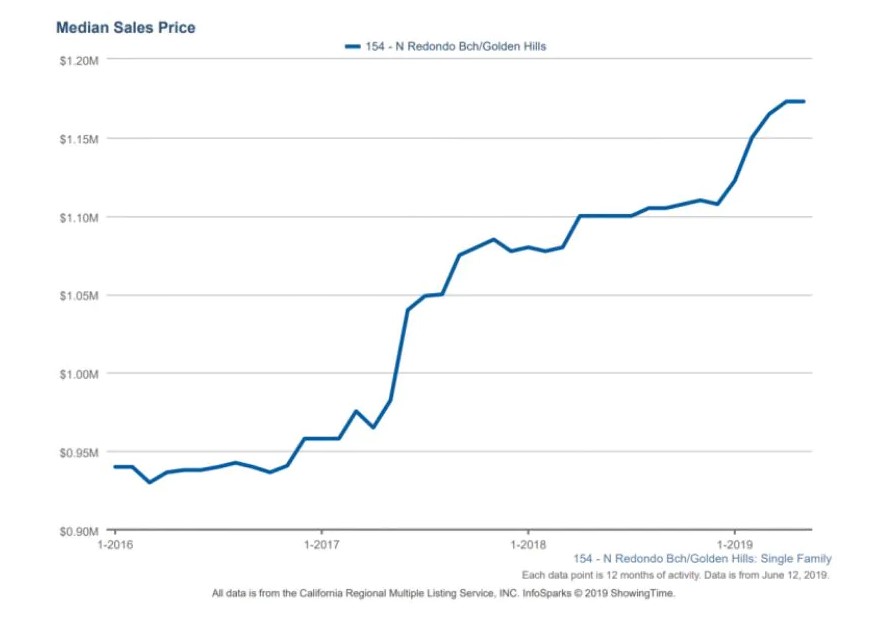
From this chart, it is pretty clear that prices are rising consistently year-over-year since 2016.
Three-Year Months Supply Data
Below is a Golden Hills single-family months supply chart during the last three years.
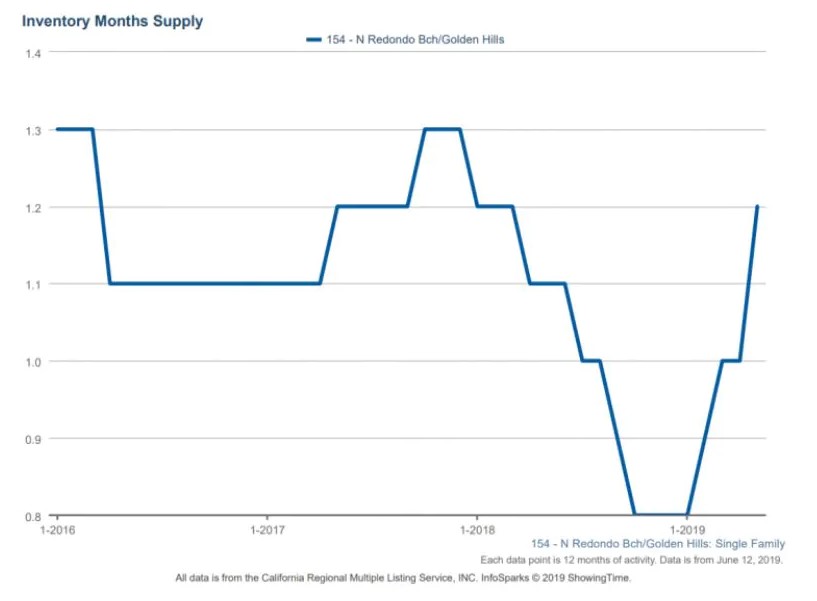
As you can see, supply is about as tight as it has ever been. Currently, there is only 1.3 months worth of home inventory which shows how scarce options are in Golden Hills.
Three-Year Days on Market Data
Below is a Golden Hills single-family days on market chart over the last three years.
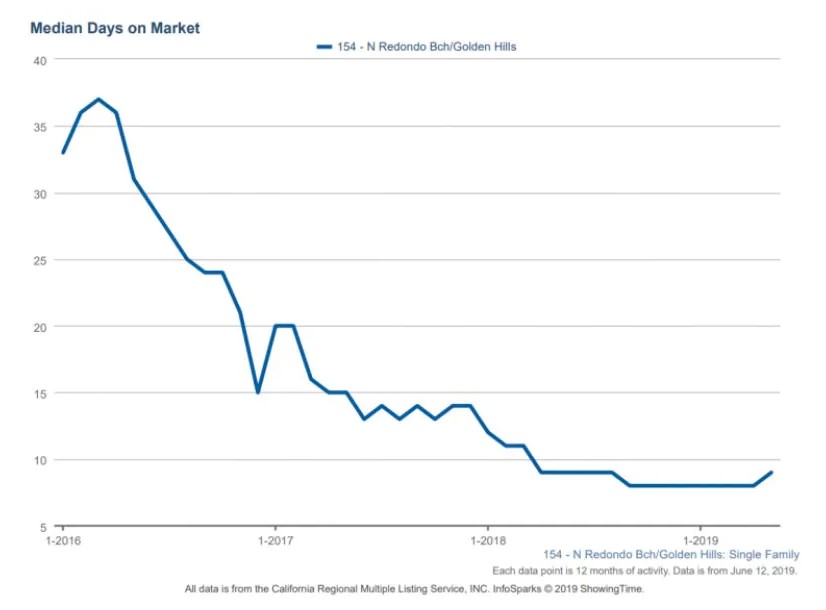
This sub-market’s days on market has come down dramatically. The median home has gone from about 30 days on the market to just under 10 days! That is a substantial drop.
The above charts demonstrate that the Golden Hills tall & skinny market price growth may have no end in sight.
Long-Term Median Sales Price Data
Now, if you look at the long-term 10-year trend, you can see just how monstrous the run up has been in the Golden Hills tall & skinny market.
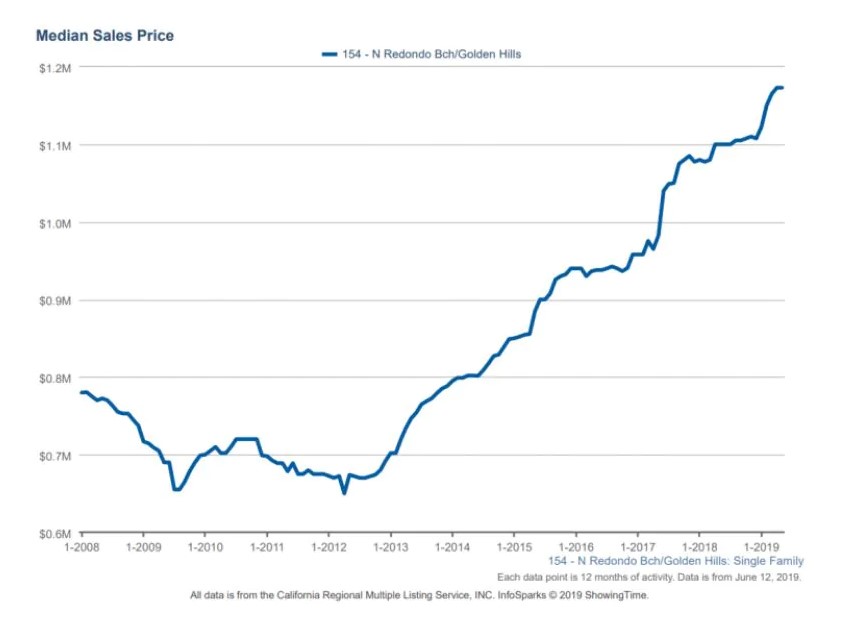
Between 2009 and 2012, the chart shows median closing sales prices around $650,000 for the Golden Hills sub-market.
Today, the market has surged up to almost $1.2 million in median sales price.
If you had bought your home at the bottom of the market between 2009 to 2012, then you have come close to doubling your money.
And furthermore, if you borrowed money, then your returns are probably amazing.
Conclusion
As one can see from the data above, the Golden Hills tall & skinny market has been on fire. Homes are being sold in under ten days and making record prices. On top of that, the months supply of homes do not show any signs of weakness or changing in the near future.
The data seems to suggest that this sub-market’s median sales price should only go up from here.
Can this amazing growth continue? Only time will tell.

Richard Haynes
DRE: 01779425
For more South Bay real estate insights, subscribe and follow Richard’s social channels below:
A leader in South Bay real estate for the better part of a decade, Richard thrives as an advisor to his clients with over $248 million in sales as a broker or investment principal at his boutique agency, Haynes. Richard is known for his keen local market insights which have been featured in the L.A. Times, The Street, and Forbes, along with his weekly South Bay real estate blog. [read more]
