
Today I am going to touch on the topic of interest rates, the Federal Reserve (Fed) balance sheet normalization, and how it is affecting real estate today and in the future.
Below I will share my exploration of charts from the Fed and a breakdown of what exactly is influencing interest rates. I am not an economist or financial advisor; I am a real estate investor and local broker studying complex economic topics and how they will impact our local South Bay market. My hope is to shed some light on a topic that will help my readers, clients, friends, family, and anyone interested in real estate.
Fed Normalization
Before I dive in, I wanted to touch on two previous blog posts I wrote on Fed normalization. In the first post from September 2017, I discussed the Fed’s plan on balance sheet normalization or the reduction of mortgage-backed and federal securities they hold on their books. There is no doubt in my mind this will impact interest rates domestically and internationally. In my opinion, the only factor that matters for the future of interest rates is how this plan will unfold.
In the second blog post from this past January, I predicted the Fed would slow down or even stop balance sheet normalization if 30-year mortgage rates jumped significantly. Well, I admit that prediction was wrong. To my surprise, The Fed has not slowed down their plan as 30-year mortgage rates jumped 0.66% from January to May of this year. They have been extremely aggressive and rising rates will be a headwind for real estate over the long-term.
Start of Balance Sheet Normalization
The Fed began its balance sheet normalization in October of 2017 and started its first three-month section of reductions.
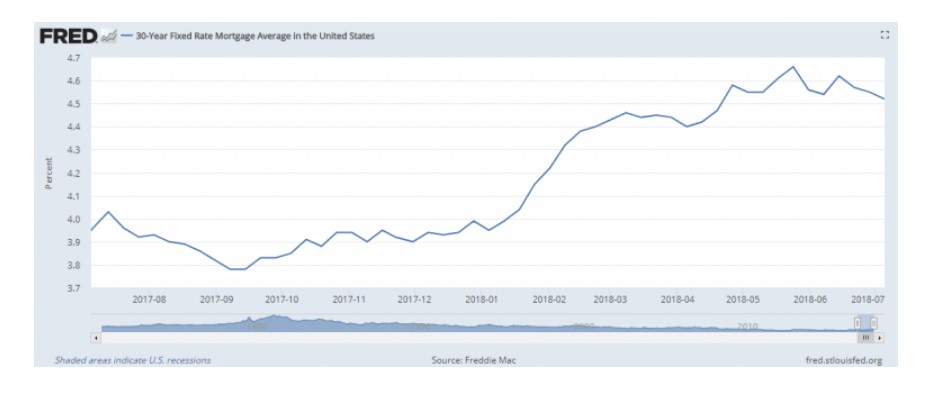
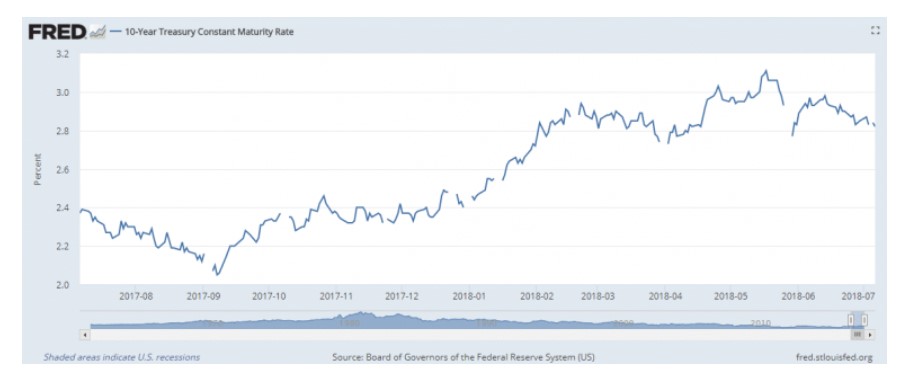
Clearly, one can see from the graph above that from October 2017 to the end of December, there was a slight leg up on the mortgage rate market. In January 2018, when the next increased reduction began, rates increased in an even bigger way. Most recently, April through June 2018 had another leg up as well. You can see the exact same pattern with the 10-Year Treasury which had reductions from the Fed balance sheet as well (see chart below).
Diving Deeper into the Asset Reductions
If we look at the Fed’s assets in total, you can easily see (below) that asset reductions began in October.
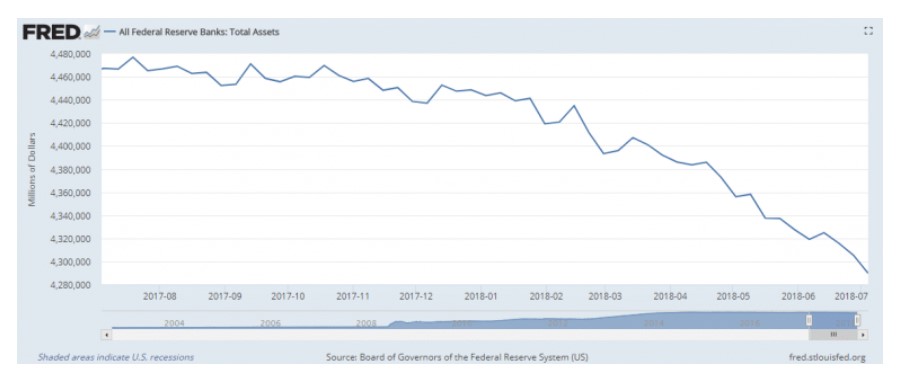
In October, the Fed began with $4.46 trillion in assets and through the end of June was down to $4.30 trillion (see the chart above). So the Fed shed about $160 billion in securities. In all likelihood, this is mostly made up of mortgage and government bonds and debt which greatly impact mortgage rates and assets prices.
So what part of the $160 billion was mortgage-backed debt? And what part was government debt?
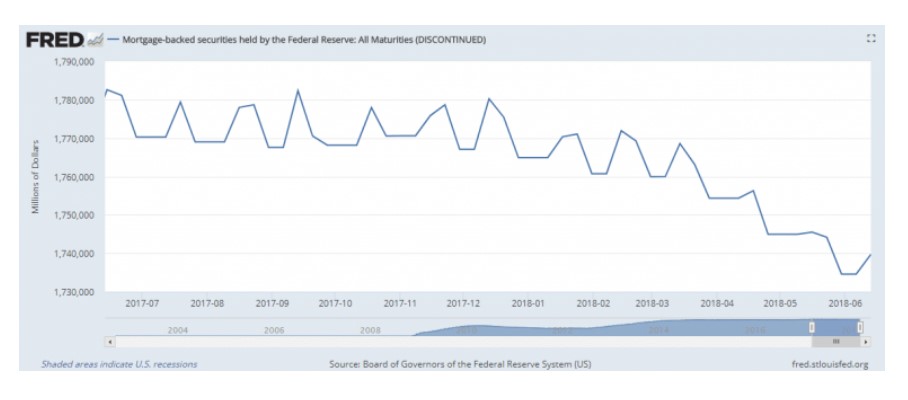
Take a look at these mortgage-backed security reductions below that were muted:
Now, here are the U.S. Treasuries being reduced at a much faster clip:
As you can see from the two charts above, the Fed reduced mortgage-backed securities by a smaller fraction relative to U.S. Treasury securities.
Mortgage-Backed Securities
- $1.77 trillion before reductions
- $1.74 trillion after nine months
That is a tiny $30 billion reduction and mortgage rates jumped in a big way.
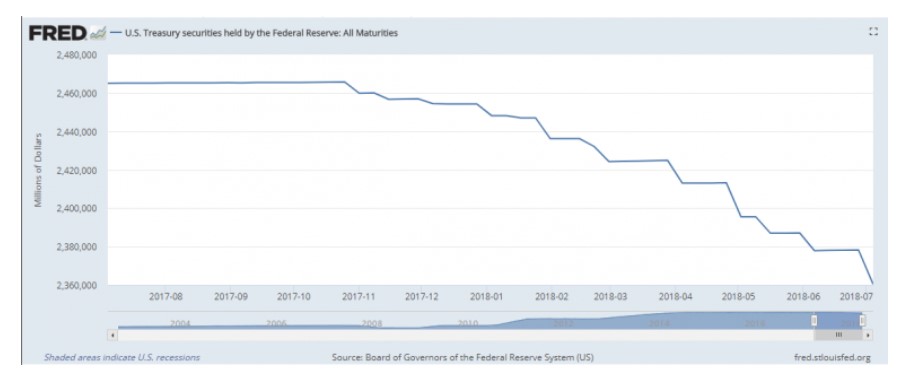
U.S. Treasury Securities
- $2.465 trillion before reductions
- $2.378 trillion after nine months
That is much more significant than mortgage-backed securities with an $87 billion reduction.
What scares me the most is the pace of normalization. If the goal is to get these securities off the Fed books, then simple math tells us it will take almost 20 years. Yes…20 years! And if mortgage rates jumped by over 15% in the first nine months (30-year fixed went from 4% to 4.66% in the first half of the year) then that is something the Fed will be watching very carefully.
What to Take Away from These Charts
In my opinion, it is all about U.S. Treasuries and the 10-Year. Bluntly, the Fed is not unloading enough mortgage-backed securities into the market to move mortgage rates directly. What is moving maortgage rates is the 10-Year. The 10-Year is being influenced by the Fed selling off U.S Treasuries causing those interest rates to rise, which in turn, is pressuring mortgage rates to go higher.
At the end of the day, the Fed has too much mortgage-backed debt to unload into the marketplace. So, they are just going to hold it until those mortgages are refinanced, paid off, or mature. They will, however, more significantly reduce other securities.
How This Will Affect Real Estate
Today, the rise in U.S. Treasuries due to asset reductions, and thus mortgage rates, is making home ownership less affordable and income property harder to pencil. Many experts are reporting fewer sales due to a tight market this year. We are seeing fewer sales in many areas here in the South Bay. Is it due to supply and demand? Or is it because interest rates are making property less affordable?
It always takes time for economic tides to have an impact on the market. Will the rising tide of interest rates over the next few months start to slow the market? Are slowing sales due to rising interest rates or supply issues? These are questions worth thinking about as the Fed continues to reduce its balance sheet.

Richard Haynes
DRE: 01779425
For more South Bay real estate insights, subscribe and follow Richard’s social channels below:
A leader in South Bay real estate for the better part of a decade, Richard thrives as an advisor to his clients with over $248 million in sales as a broker or investment principal at his boutique agency, Haynes. Richard is known for his keen local market insights which have been featured in the L.A. Times, The Street, and Forbes, along with his weekly South Bay real estate blog. [read more]
