
Bruce Norris is generally regarded as one of the best California residential real estate forecasters. Not only is he self-taught in real estate economics and data, but he is also a real estate investor himself. He is a great source because he depends on his own predictions to correctly make decisions for his business. For further background, check out a previous blog post I wrote on Bruce Norris predictions here.
Bruce Norris Event
This last weekend I attended Bruce’s event, “California Real Estate: On Borrowed Time” in Riverside. Upon arrival we received a 250-page book with hundreds of different charts, illustrating that he really does his homework. These charts provided data on various topics such as construction, demographics, migration, interest rates, national debt, and employment, just to name a few.
Bruce went through every chart with us in detail to explain how he made his conclusions. He even withholds the most important chapters to make sure you stay until the end (eight hours later)…my back still hurts! But I will tell you, hearing his insight in detail is worth it.
Affordability
The main takeaway from the event was about California affordability. Statistics show historically if a great number of residents can afford homes, prices will go up. However, if a great number of residents cannot afford homes, prices tend to go down.
Pretty simple, right? Check out this affordability chart…
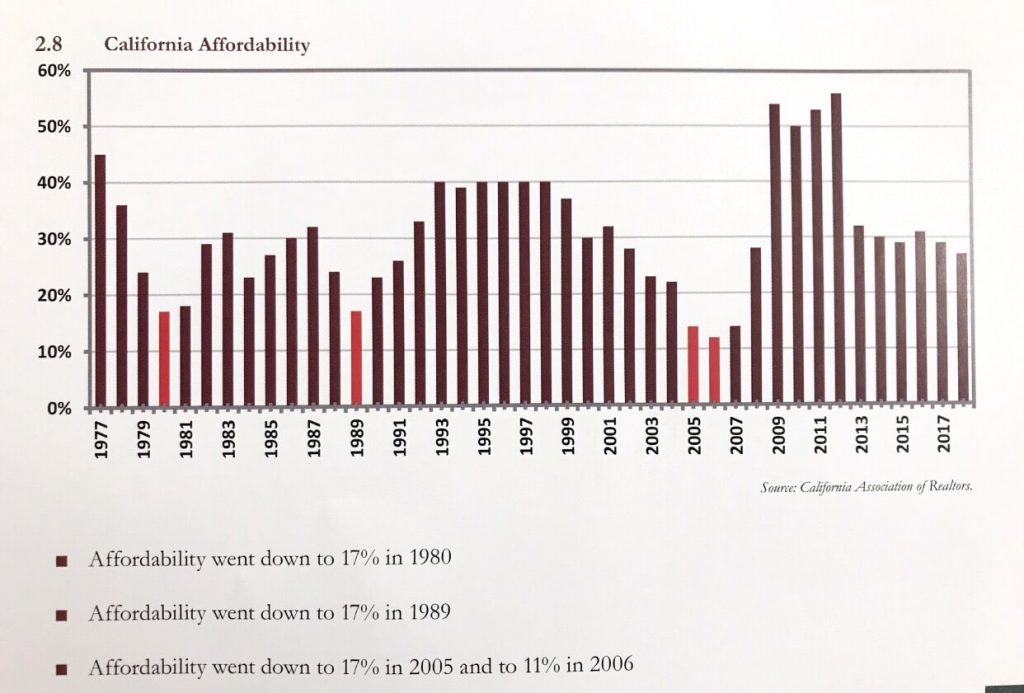
As you can see, there is a trend showing when affordability gets low (17 percent) then California real estate reacts poorly. Every time California hits 17 percent or lower, sales decline soon after. Let’s take a look…
- Sales declined from 377,664 to 189,345 from 1980 to 1982
- Sales declined from 435,521 to 300,020 from 1989 to 1991
- Sales declined from 576,240 to 292,420 from 2005 to 2007
With regards to how that affected prices, look at the California Median Price versus California Affordability chart…
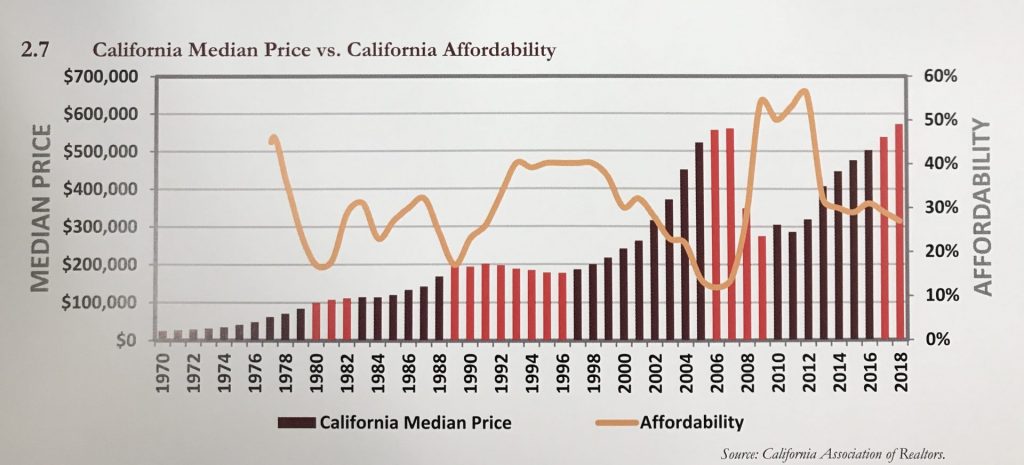
As you can see, prices either went flat or had a decline.
- Median price in CA went from $99,600 in 1980 to $111,800 in 1982
- Median price in CA went from $196,000 in 1989 to $177,000 in 1996
- Median price in CA went from $580,000 in 2006 to $280,000 in 2009
At equilibrium, Bruce believes the California market tops out when we reach 17 percent on the affordability chart.
During the time of the Great Recession, it was different due to very easy money. In 2005, we hit 17 percent, but loose lending allowed the market to run to a crazy 12 percent affordability level in 2006 before it crashed.
This time around, Bruce feels that due to strict lending and other factors never seen before (i.e. rising health insurance, expensive child care, and student debt) California will not get to 17 percent, but instead, reach its peak earlier than normal.
How to Predict
Bruce disclosed to us exactly what number he believes is “the new 17 percent.” We are much closer to it than most expect.
I know some would like to know that number, but at this time I am going to be a major buzzkill and withhold the information for exclusive use of our Manhattan Pacific agents and clients.
What I can tell you is, it will not be close to the crash like 2008-2012, but there will be a price correction in the near future.
For our clients who are interested in the new affordability number and information, please DM, email, or call me and I will gladly share the results in detail.
The Time Frame
Now, what I can share is a time frame for when prices will bottom and some additional data on how to time it.
At 17 percent affordability, California tends to trend with national median prices…
- In 1989, California was 207% of the national price
- In 2006, California was 257% of the national price
- In 2018, California is 220% of the national price (hint, hint)
In the event of a price reversal, California goes to a ratio between 145 percent and 160 percent of the national price. Bruce believes that once we reach the state’s price peak, California and United States median prices will gradually close the price gap until it reaches a ratio of 170 percent.
That would be a low of $498,350 California median price achieved in the medium-term (we are currently around $600,000).
For long-term investors, Bruce believes in 2027 California median prices will reach a new high of $717,929 according to his data and research.
At the end of the day, if you are a first time home buyer or a short-term buyer, it will probably pay to wait. If you are a long-term holder of real estate, then eight years from now looks pretty darn good.
Conclusion
All in all, I am sticking to my earlier predictions after spending the day with Bruce Norris. For those of you who have not read my 2019 predictions blog here is a short recap…
- Sellers should sell this year, especially in the first half of the year.
- First time buyers should be patient and short-term buyers should wait.
- Long term buyers (and holders) should continue to hold
great property over the long term.
I plan to mail out a “Special Report” addressing the South Bay real estate market in its current state and how to navigate the next few years. It will be exclusive to those on my snail mail list. If you would like to receive the report, or hear about all of Bruce’s predictions, then please email me…I would be happy to share!

Richard Haynes
DRE: 01779425
For more South Bay real estate insights, subscribe and follow Richard’s social channels below:
A leader in South Bay real estate for the better part of a decade, Richard thrives as an advisor to his clients with over $248 million in sales as a broker or investment principal at his boutique agency, Haynes. Richard is known for his keen local market insights which have been featured in the L.A. Times, The Street, and Forbes, along with his weekly South Bay real estate blog. [read more]
