


This week’s blog is inspired by Diana Olick’s CNBC article highlighting national home sales slumping to their lowest levels since 1995. A level not seen in the housing market in nearly three decades!
Let me share the main points of her write-up:
- Full-year 2023 homes sales in the United States totaled 4.09 million units.
- Inventory to end the year, however, was up 4.2% compared to the end of 2022.
- There were around 1 million homes for sale at the end of 2023, making for about 3.2 months of supply (a market at equilibrium is considered six months of supply).
- First-time homebuyers are struggling making up just 29% of December sales, down 31% from the year before; and historically, these buyers make up 40% of sales.
Find the full article here.
To bring more context to Olick’s article and how it relates to our local markets, I decided to dig a little deeper with research from the National Association of Realtors and our local MLS.
Interesting National Statistics (NAR)
Olick gets much of her research from NAR and even pulled quotes from Lawrence Yun, Chief Economist at NAR. So I went digging into some of their excellent write-ups on low sales numbers.
This chart from NAR / U.S. Census is so good that I had to paste it below:
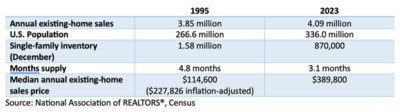

If you look closely at that chart, it is as shocking as it is telling.
While 1995 had fewer home sales by almost 250,000 sales, our population today is significantly larger in 2023, standing at almost 70 million more residents than three decades ago.
What’s more, single-family home inventory today is essentially half of what it was in 1995 showing just how tight the for-sale home inventory squeeze really is. And of course, inflation-adjusted we are at a much higher median price as well which is making life tough on first-time homebuyers.
I encourage you to read the excellent write-up by Jessica Lautz, in full, at the NAR site here as it shows other interesting comparables from 1995 vs. 2023.
Los Angeles County Statistics (CRMLS)
When it comes to the county of Los Angeles and our local home markets that we care about in the South Bay, I wanted to share the statistics from CRMLS that go back to 2008.
Spoiler alert: L.A. County home sales and inventory mirror, for the most part, the national statistics.
Los Angeles County Home Sale Facts
- County home sales fell by 22% in 2023 compared to 2022
- Just over 44,000 home sales in the county in 2023, that is lower than the worst of the Great Recession
- Those 44k home sales are 44% lower than peak sales experienced at the end of 2021’s Covid home buying frenzy
Los Angeles County Inventory Facts
- County for-sale homes plummeted to all-time lows in 2023 to just over 10,000 listings
- This is 50% lower compared to a decade ago when the MLS was accustomed to over 22,000 homes for sale in L.A. County
- During the Great Recession, MLS listings rose to a peak of over 56,000 listings in 2008
As you can see, our county is sitting at depressed sales and inventory levels much like the national statistics illustrate.
Local South Bay Statistics (CRMLS)
In case you missed my year end recap of 2023 performance from Manhattan Beach to the Palos Verdes Peninsula, please reference that post here. I want to reshare sales (from the previous post) and inventory for specific South Bay areas for your real estate moves in 2024.
South Bay Sales Data
Blog Recap on Sales in 2023:
Manhattan Beach
- Sales hit a record low for the beach city
- Year-over-year, sales were down by 21.4%
Palos Verdes Peninsula (PVE & RPV)
- PVE & RPV make up nearly 80% of sales and were at record lows
- Both cities were down double-digits, year-over-year
Hermosa Beach
- Sales hit a record low for this tiny beach city
- Year-over-year, sales were down by 25.3%
Redondo Beach (some Hollywood Riviera)
- Sales were approaching record lows
- Year-over-year, sales were down by 14.7%
What I did not highlight in the past blog was for sale inventory in our local beach cities and the Palos Verdes Peninsula. Let’s examine…
South Bay Inventory Data
Manhattan Beach
- Inventory is close to historic lows, however, for sale listings have been lower in four in four different years; MB is no stranger to supply squeezes
- That said, inventory is more constrained than the period between 2017 – 2021
Palos Verdes Peninsula (PVE & RPV)
- While inventory is mixed year-over-year, P.V. Hill for sale listings in 2022 and 2023 is significantly lower than any other time in its history…by a long shot
- Looking back a decade ago, The Hill is more accustomed to DOUBLE the listings
Hermosa Beach
- Much like Manhattan Beach, inventory is close to historic lows, but there have been multiple times in history where there has been a greater squeeze in Hermosa
- And again, compared to 2017 – 2021, Hermosa inventory is lower today
Redondo Beach (some Hollywood Riviera)
- Redondo Beach is just above historic inventory lows reached in 2022
- The city typically enjoyed 120 to 150 listings over the past decade, now listings trend in the low 90s
Final Thoughts
It is not often that I write about national trends or cite other articles, but I think the national year end statistics are an interesting calculus.
Our Los Angeles marketplace is demonstrating many of the low sale / low inventory challenges experienced by the rest of the country. And the historical perspective from NAR and the U.S. Census really offers an incredible historical comparison.
Many Realtors are expecting (or perhaps hoping, praying…) for more inventory and eventual sales in 2024. I do not disagree with those sentiments as it is not hard to go higher after reaching all-time historical lows.
But you just never know what surprises the real estate market might throw at us.
So, when it comes to rising inventory and sales… I will believe it when I see it.